File:Absolute value.svg
From Vigyanwiki

Size of this PNG preview of this SVG file: 600 × 400 pixels. Other resolutions: 320 × 213 pixels | 640 × 427 pixels | 1,024 × 683 pixels | 1,280 × 853 pixels | 2,560 × 1,707 pixels.
Original file (SVG file, nominally 600 × 400 pixels, file size: 1 KB)
W3C-validity not checked.
Summary
| Description |
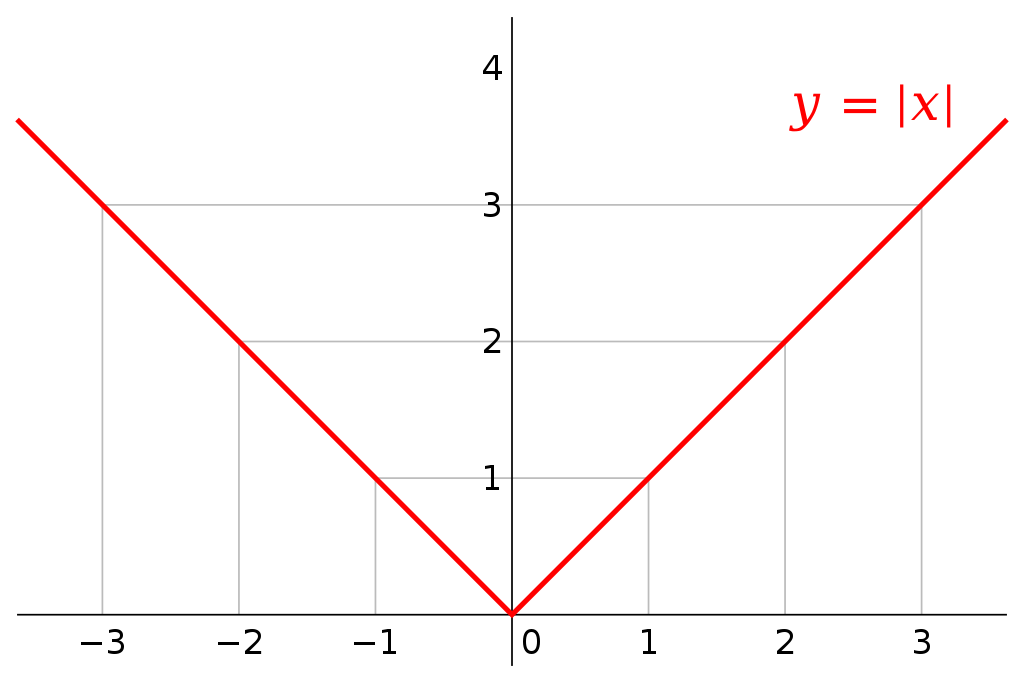
Icelandic: sést hér sem rauð is:lína í kartesíusarhnitakerfi. Þar sem is:algildi táknar is:fjarlægð frá núlli birtist línan begج لاgja megin við is:miðásinn. Í stað þess að birtast bara öðru megin ef hún væri já– eða neikvæð es:Imagen:Modulo.png (derived from the former) (now in the history). |
| Date | (UTC) |
| Source |
|
| Author |
|

I, the copyright holder of this work, hereby publish it under the following licence:

|
Permission is granted to copy, distribute and/or modify this document under the terms of the GNU Free Documentation Licence, Version 1.2 or any later version published by the Free Software Foundation; with no Invariant Sections, no Front-Cover Texts, and no Back-Cover Texts. A copy of the licence is included in the section entitled GNU Free Documentation Licence. |
| This file is licensed under the Creative Commons Attribution-Share Alike 3.0 Unported licence. | ||
| ||
| This licencing tag was added to this file as part of the GFDL licencing update. |
Original upload log
This image is a derivative work of the following images:
- Image:Absolute_value.png licensed with GFDL
- 2004-11-30T23:44:36Z Ævar Arnfjörð Bjarmason 304x199 (2240 Bytes)
Uploaded with derivativeFX
File history
Click on a date/time to view the file as it appeared at that time.
| Date/Time | Thumbnail | Dimensions | User | Comment | |
|---|---|---|---|---|---|
| current | 01:43, 28 December 2017 | | 600 × 400 (1 KB) | wikimediacommons>Perhelion | using mathematical unicode signs for x/y 𝑥/𝑦 // Editing SVG source code using User:Rillke/SVGedit.js; upload handled by User:Rillke/MwJSBot.js |
File usage
The following 4 pages use this file: