File:English letter frequency (alphabetic).svg
From Vigyanwiki
.svg)
.svg&action=edit&redlink=1)
.svg)

Size of this PNG preview of this SVG file: 600 × 480 pixels. Other resolutions: 300 × 240 pixels | 960 × 768 pixels | 1,280 × 1,024 pixels | 2,560 × 2,048 pixels.
Original file (SVG file, nominally 600 × 480 pixels, file size: 21 KB)
Summary
| Description |
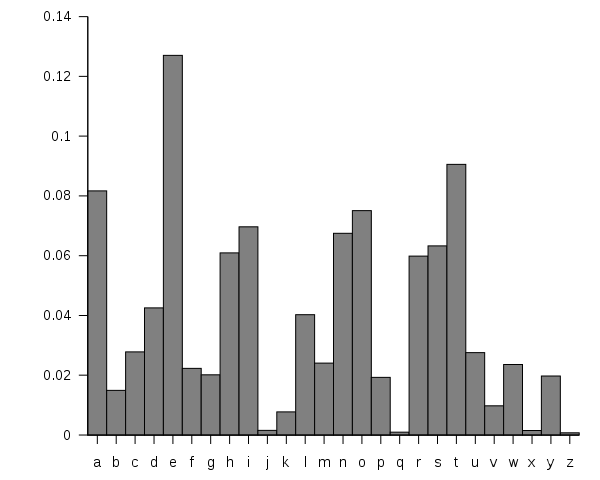
Čeština: Relativní četnosti písmen angličtiny, seřazeno abecedně English: English letter frequencies, sorted alphabetically |
||
| Date | |||
| Source | Own work; en:Letter frequency. | ||
| Author | Nandhp | ||
| Permission (Reusing this file) |
|
||
| Other versions |
.svg) .svg) |
Generated with these files:
english-letter-frequency.dat:
"a"	8.167	1	"e"	12.702	1
"b"	1.492	2	"t"	9.056	2
"c"	2.782	3	"a"	8.167	3
"d"	4.253	4	"o"	7.507	4
"e"	12.702	5	"i"	6.9662	5
"f"	2.228	6	"n"	6.749	6
"g"	2.015	7	"s"	6.327	7
"h"	6.094	8	"h"	6.094	8
"i"	6.966	9	"r"	5.987	9
"j"	0.153	10	"d"	4.253	10
"k"	0.772	11	"l"	4.025	11
"l"	4.025	12	"c"	2.782	12
"m"	2.406	13	"u"	2.758	13
"n"	6.749	14	"m"	2.406	14
"o"	7.507	15	"w"	2.360	15
"p"	1.929	16	"f"	2.228	16
"q"	0.095	17	"g"	2.015	17
"r"	5.987	18	"y"	1.974	18
"s"	6.327	19	"p"	1.929	19
"t"	9.056	20	"b"	1.492	20
"u"	2.758	21	"v"	0.978	21
"v"	0.978	22	"k"	0.772	22
"w"	2.360	23	"j"	0.153	23
"x"	0.150	24	"x"	0.150	24
"y"	1.974	25	"q"	0.095	25
"z"	0.074	26	"z"	0.074	26
english-letter-frequency.gnuplot:
set term svg
set key off
set style fill solid 1 border -1
set tics out nomirror
set border 3
set xrange [.5:26.5]

set output "English letter frequency (alphabetic).svg"
set xtics ("a" 1, "b" 2, "c" 3, "d" 4, "e" 5, "f" 6, "g" 7, "h" 8, "i" 9, "j" 10, "k" 11, "l" 12, "m" 13, "n" 14, "o" 15, "p" 16, "q" 17, "r" 18, "s" 19, "t" 20, "u" 21, "v" 22, "w" 23, "x" 24, "y" 25, "z" 26)
plot "english-letter-frequency.dat" using 3:($2/100) with boxes lt 0

set output "English letter frequency (frequency).svg"
set xtics ("e" 1, "t" 2, "a" 3, "o" 4, "i" 5, "n" 6, "s" 7, "h" 8, "r" 9, "d" 10, "l" 11, "c" 12, "u" 13, "m" 14, "w" 15, "f" 16, "g" 17, "y" 18, "p" 19, "b" 20, "v" 21, "k" 22, "j" 23, "x" 24, "q" 25, "z" 26)
plot "english-letter-frequency.dat" using 6:($5/100) with boxes lt 0
File history
Click on a date/time to view the file as it appeared at that time.
| Date/Time | Thumbnail | Dimensions | User | Comment | |
|---|---|---|---|---|---|
| current | 08:10, 10 April 2010 | | 600 × 480 (21 KB) | wikimediacommons>Nandhp | {{Information |Description={{en|1=English letter frequencies, sorted alphabetically.}} |Source={{own}}; en:Letter frequency. |Author=Nandhp |Date=2010-04-09 |Permission={{pd-self}} |other_versions=[[File:English_letter_frequency_(alph |
File usage
The following page uses this file:
.svg)
.svg)
.svg&action=info)