File:Low temperature thermocouples reference functions.svg
From Vigyanwiki
Low temperature thermocouples reference functions.svg

Size of this PNG preview of this SVG file: 270 × 270 pixels. Other resolutions: 240 × 240 pixels | 480 × 480 pixels | 768 × 768 pixels | 1,024 × 1,024 pixels | 2,048 × 2,048 pixels.
Original file (SVG file, nominally 270 × 270 pixels, file size: 41 KB)
This file is from Wikimedia Commons and may be used by other projects. The description on its file description page there is shown below.
Summary
| DescriptionLow temperature thermocouples reference functions.svg |
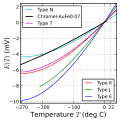
English: Type E,J,K,N,T thermocouples' reference functions, using NIST ITS-90 calibration curves.
Русский: Градуировочные кривые термопар типов E, J, K, N, T по стандарту NIST ITS-90 |
| Date | |
| Source | Own work |
| Author | Nanite |
| Other versions |
|
The file size of this SVG image may be abnormally large because most or all of its text has been converted to paths rather than using the more conventional
<text> element. Unless rendering the text of the SVG file produces an image with text that is incurably unreadable due to technical limitations, it is highly recommended to change the paths back to text. Doing so will ease the process of localizing this image to other languages and is likely to reduce the file size in a significant scale. Other SVGs containing path-based text can be found at Category:Path text SVG. For more information, see SVG: Fonts and Preparing images for upload: Text.беларуская (тарашкевіца) ∙ Deutsch ∙ English ∙ español ∙ magyar ∙ italiano ∙ 日本語 ∙ македонски ∙ русский ∙ slovenščina ∙ svenska ∙ ไทย ∙ Tiếng Việt ∙ 中文 ∙ 中文(中国大陆) ∙ 中文(简体) ∙ 中文(繁體) ∙ 中文(香港) ∙ 中文(新加坡) ∙ 中文(臺灣) ∙ +/− |  |
Source
Python source code. Requires matplotlib and thermocouples_reference package.
from pylab import *
from thermocouples_reference import *

figtype = '.svg'
saveopts = {} #'bbox_inches':'tight'} #, 'transparent':True, 'frameon':True}

def doplot(tclist,T,endlabels=True):
    fig = figure()
    ax = axes([0.17,0.14,0.80,0.83])
    #T = linspace(lim[0],lim[1],2001)
    for letter,tc in tclist:
        print(tc)
        emf = tc.emf_mVC(T,out_of_range="nan")
        l = plot(T, emf, label=tc.type)[0]
        if endlabels:
            Tmax = tc.maxT_C; emfmax = tc.emf_mVC(Tmax)
            text(Tmax,emfmax,tc.type, fontsize='x-small',
                 color=l.get_color(),va='center')
    ax.tick_params(labelsize="x-small")
    xlabel("Temperature $T$ (deg C)")
    ylabel("$E(T)$ (mV)")
    xlim(amin(T),amax(T))
    fig.set_size_inches(3,3)
    fig.patch.set_alpha(0)
    grid()

if __name__ == '__main__':
    ##### Low temperature
    lowTcouples = [(k, thermocouples[k]) for k in list('EJKNT')+['AuFe 0.07']]
    doplot(lowTcouples,linspace(-273.015,40.,2001),endlabels=False)
    ylim(-10.5,2.1)
    xticks([-270,-200,-100,0,22])
    # dual legend
    ul = [gca().lines[i] for i in [3,5,4]]
    ll = [gca().lines[i] for i in [2,1,0]]
    l1 = legend(ul, [l.get_label() for l in ul],fontsize="x-small",loc='upper left')
    l2 = legend(ll, [l.get_label() for l in ll],fontsize="x-small",loc='lower right')
    gca().add_artist(l1)
    savefig('low_t_thermocouples'+figtype,**saveopts)

    ##### Medium temperature
    medTcouples = [(k, thermocouples[k]) for k in
    list('EJKNTPM')+[
        'Au/Pt',
        'Pt/Pd',
        ]
    ]
    doplot(medTcouples,linspace(-110.,1790.,2001))
    ylim(-6,82)
    xticks([0,500,1000,1500])
    gca().texts[1].set_ha('center') # type J
    gca().texts[1].set_va('bottom') # type J
    gca().texts[2].set_ha('center') # type K
    gca().texts[2].set_va('bottom') # type K
    gca().texts[5].set_va('top') # type P
    gca().lines[5].set_zorder(1)   # type P
    gca().texts[5].set_text('Type P') # type P
    gca().texts[4].set_ha('right') # type T
    gca().texts[4].set_va('bottom') # type T
    gca().lines[4].set_zorder(9)   # type T
    gca().texts[-2].set_va('bottom') # AuPt
    savefig('med_t_thermocouples'+figtype,**saveopts)

    ##### High temperature
    highTcouples = [(k, thermocouples[k]) for k in
        list('CDGBRS')+[
            'PtMo 5/0.1',
            'PtRh 40/20',
            'Pt/Pd',
            'IrRh 40/0',
            ]
        ]
    doplot(highTcouples,linspace(-70.,2850.,2421))
    ylim(-2,49)
    gca().texts[1].set_ha('center') # type D
    gca().texts[1].set_va('bottom') # type D
    gca().texts[0].set_va('top') # type C
    savefig('high_t_thermocouples'+figtype,**saveopts)
Licensing
I, the copyright holder of this work, hereby publish it under the following licence:
| This file is made available under the Creative Commons CC0 1.0 Universal Public Domain Dedication. | |
| The person who associated a work with this deed has dedicated the work to the public domain by waiving all of their rights to the work worldwide under copyright law, including all related and neighbouring rights, to the extent allowed by law. You can copy, modify, distribute and perform the work, even for commercial purposes, all without asking permission.
http://creativecommons.org/publicdomain/zero/1.0/deed.enCC0Creative Commons Zero, Public Domain Dedicationfalsefalse |
Captions
Add a one-line explanation of what this file represents
Items portrayed in this file
depicts
7 December 2013
File history
Click on a date/time to view the file as it appeared at that time.
| Date/Time | Thumbnail | Dimensions | User | Comment | |
|---|---|---|---|---|---|
| current | 20:42, 5 January 2014 |  | 270 × 270 (41 KB) | wikimediacommons>Nanite | slight tweaks |
File usage
The following page uses this file:
Metadata
This file contains additional information, probably added from the digital camera or scanner used to create or digitise it.
If the file has been modified from its original state, some details may not fully reflect the modified file.
| Width | 216pt |
|---|---|
| Height | 216pt |
