File:Pareto.PNG
From Vigyanwiki
Size of this preview: 800 × 600 pixels. Other resolutions: 320 × 240 pixels | 640 × 480 pixels | 1,024 × 768 pixels | 1,280 × 960 pixels | 1,440 × 1,080 pixels.
Original file (1,440 × 1,080 pixels, file size: 99 KB, MIME type: image/png)
Summary
| Description |
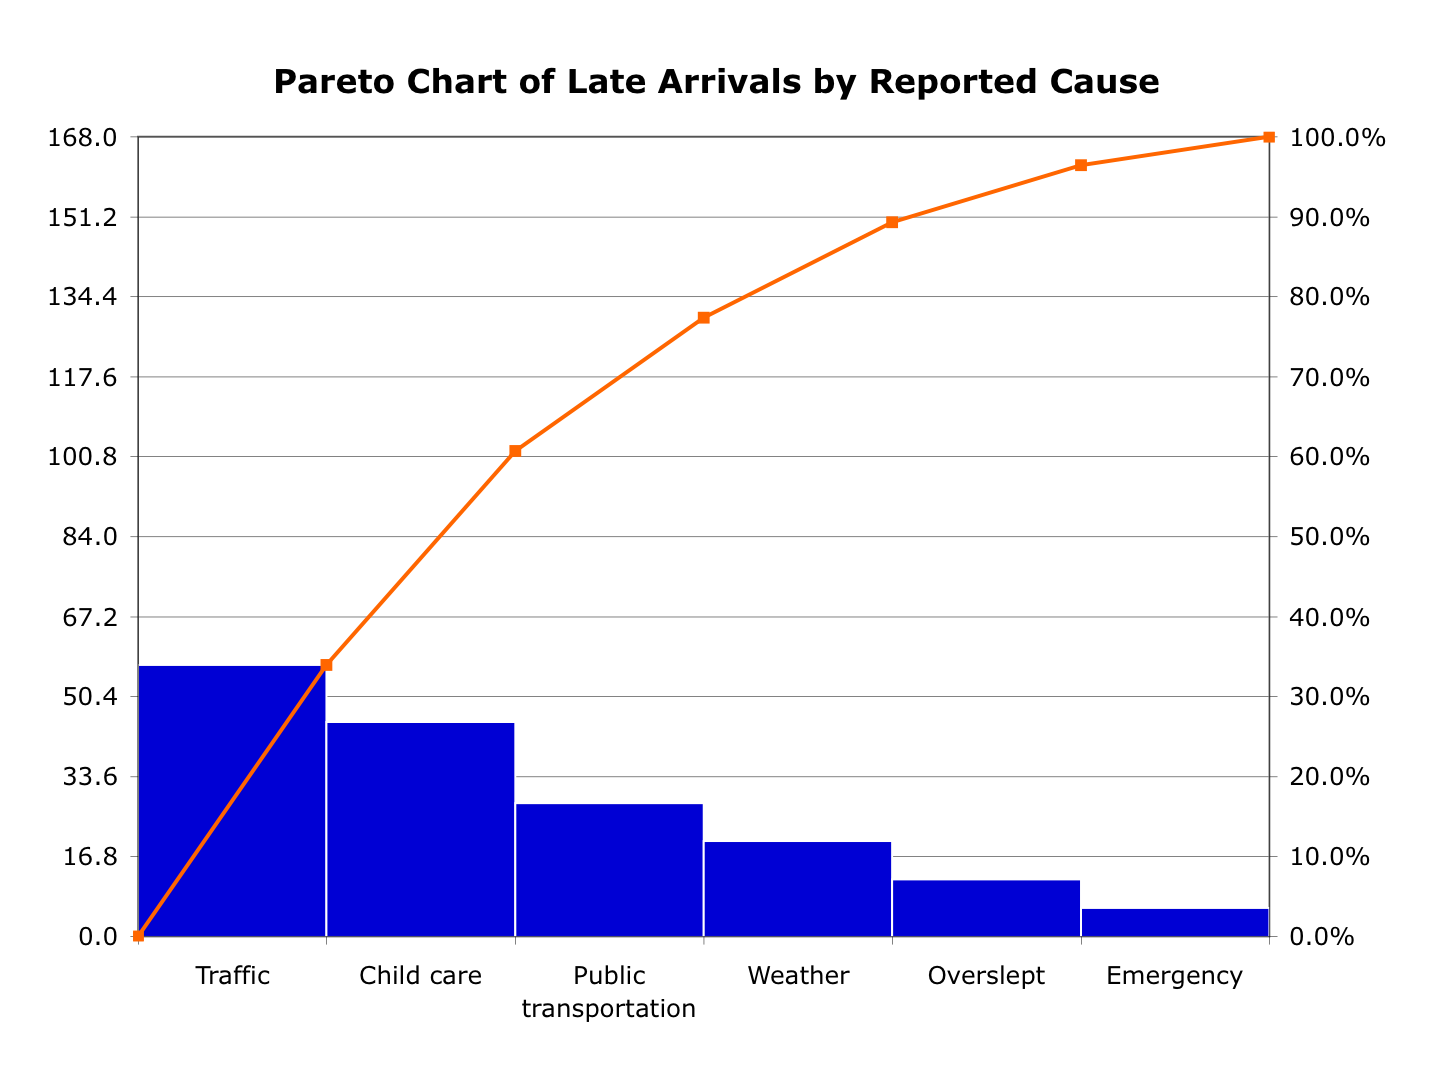
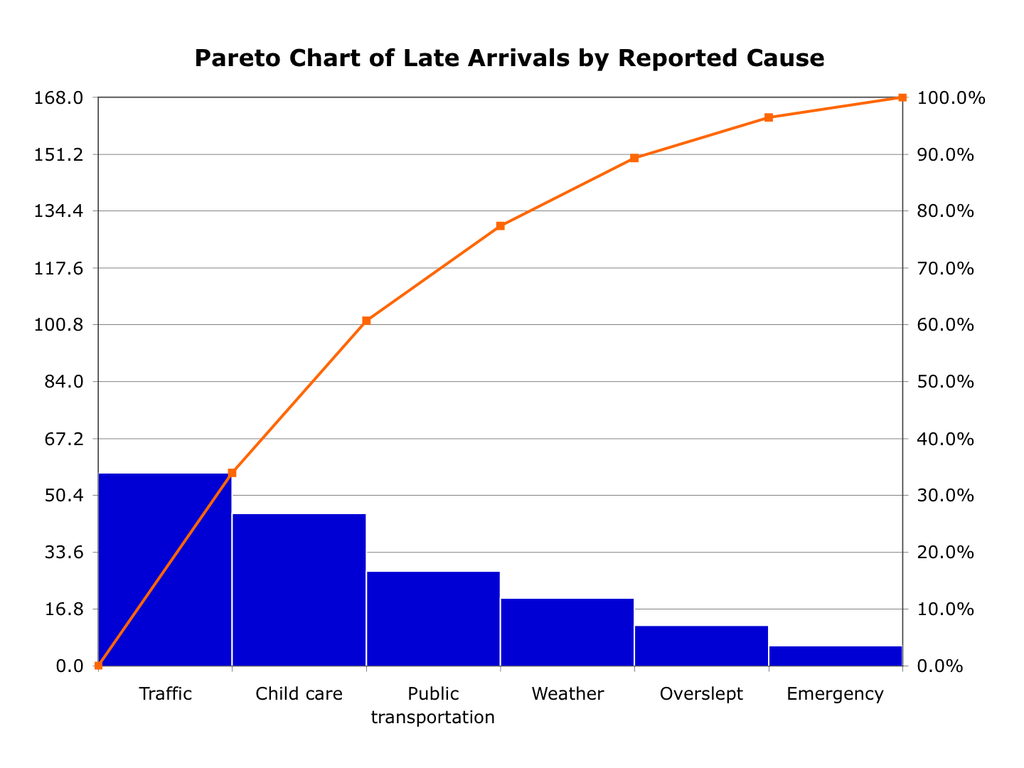
English: I created this file myself using Microsoft Excel and Microsoft PowerPoint. The data is purely hypothetical.
Your chart is not a good one - especially for the categories you've depicted. The left side axis can only be whole numbers (discrete data), for how can you have a partial cause of traffic, or child care? Its actually a completely valid graph due to the fact that none of the data actually falls on a non-integer y-value. Thus, it is very difficult if not impossible to predict whether each category has a non-integer value. |
| Date | 10 March 2006 (original upload date) |
| Source | Transferred from en.wikipedia to Commons by Common Good using CommonsHelper. |
| Author | Metacomet at English Wikipedia |
Licensing
| This work has been released into the public domain by its author, Metacomet at English Wikipedia. This applies worldwide. In some countries this may not be legally possible; if so: Metacomet grants anyone the right to use this work for any purpose, without any conditions, unless such conditions are required by law. |
Original upload log
The original description page was here. All following user names refer to en.wikipedia.
- 2006-03-10 06:51 Metacomet 1440×1080× (101105 bytes) I created this file myself using Microsoft Excel and Microsoft PowerPoint.
File history
Click on a date/time to view the file as it appeared at that time.
| Date/Time | Thumbnail | Dimensions | User | Comment | |
|---|---|---|---|---|---|
| current | 01:12, 11 March 2009 | | 1,440 × 1,080 (99 KB) | wikimediacommons>File Upload Bot (Magnus Manske) | {{BotMoveToCommons|en.wikipedia|year={{subst:CURRENTYEAR}}|month={{subst:CURRENTMONTHNAME}}|day={{subst:CURRENTDAY}}}} {{Information |Description={{en|I created this file myself using Microsoft Excel and Microsoft PowerPoint. The data is purely hypothet |
File usage
The following page uses this file: