File:Rate distortion function.png
Rate_distortion_function.png (587 × 259 pixels, file size: 3 KB, MIME type: image/png)
This file is from Wikimedia Commons and may be used by other projects. The description on its file description page there is shown below.
Transferred from en.wikipedia to Commons by Maksim.
Summary
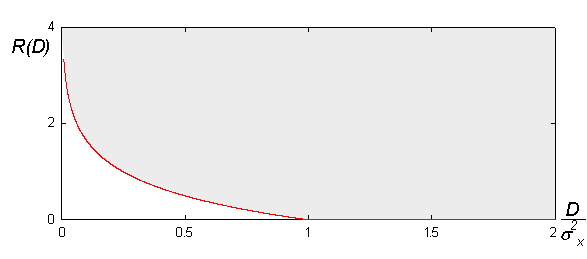
A graph illustrating a rate distortion function, as described in rate distortion theory. Based on a JPEG by Inald Lagendijk (Image:RDCurve.jpg), cleaned up per request.

|
This graph image could be re-created using vector graphics as an SVG file. This has several advantages; see Commons:Media for cleanup for more information. If an SVG form of this image is available, please upload it and afterwards replace this template with
{{vector version available|new image name}}.
It is recommended to name the SVG file “Rate distortion function.svg”—then the template Vector version available (or Vva) does not need the new image name parameter. |
Licensing

|
Permission is granted to copy, distribute and/or modify this document under the terms of the GNU Free Documentation Licence, Version 1.2 or any later version published by the Free Software Foundation; with no Invariant Sections, no Front-Cover Texts, and no Back-Cover Texts. A copy of the licence is included in the section entitled GNU Free Documentation Licence.http://www.gnu.org/copyleft/fdl.htmlGFDLGNU Free Documentation Licensetruetrue |
| This file is licensed under the Creative Commons Attribution-Share Alike 3.0 Unported licence. | ||
| ||
| This licensing tag was added to this file as part of the GFDL licensing update.http://creativecommons.org/licenses/by-sa/3.0/CC BY-SA 3.0Creative Commons Attribution-Share Alike 3.0truetrue |
| date/time | username | edit summary |
|---|---|---|
| 08:57, 18 October 2005 | en:User:Mysid | (A graph illustrating a rate distortion function, as described in <a href="/wiki/Rate_distortion_theory" title="Rate distortion theory">rate distortion theory</a>. Based on a JPEG by <a href="/w/index.php?title=User:Inald&action=edit" class="new" title="User:Inald">Inald Lagendijk</a> (<a href="/w/index.php?title=Image:RDCurve.jpg&action=edit" class="new" title="Image:RDCurve.jpg">:Image:RDCurve.jpg</a>), cleaned up per request. <a href="/wiki/Category:Graphs_%28images%29" title="Category:Graphs (images)">Category:Graphs (images)</a>) |
Original upload log
Legend: (cur) = this is the current file, (del) = delete this old version, (rev) = revert to this old version.
Click on date to download the file or see the image uploaded on that date.
- (del) (cur) 08:57, 18 October 2005 . . en:User:Mysid Mysid ( en:User_talk:Mysid Talk) . . 358x259 (859 bytes) (A graph illustrating a rate distortion function, as described in en:Rate_distortion_theory rate distortion theory. Based on a JPEG by Inald Lagendijk (:Image:RDCurve.jpg), cleaned up per request. en:Category:Graphs_(images) Category:Graphs (images))
en:Image:Rate distortion function.png
Captions
Items portrayed in this file
depicts
File history
Click on a date/time to view the file as it appeared at that time.
| Date/Time | Thumbnail | Dimensions | User | Comment | |
|---|---|---|---|---|---|
| current | 03:48, 5 November 2018 |  | 587 × 259 (3 KB) | wikimediacommons>Fvultier | extended x-axis to 2 instead of only to 1. |
File usage
The following page uses this file:
Metadata
This file contains additional information, probably added from the digital camera or scanner used to create or digitise it.
If the file has been modified from its original state, some details may not fully reflect the modified file.
| Horizontal resolution | 37.79 dpc |
|---|---|
| Vertical resolution | 37.79 dpc |
| Software used |
|
